


Your humble editor participates in quarterly calls with investors to discuss the state of the lighting industry and to give our insights on various companies. In preparation for these calls we look at our own internal advertising numbers as one metric to discuss. The belief is that our advertising data can be a fairly consistent monitor of sentiment in our industry.
For this index, we only look at two of our four advertising categories: Employment Ads and Press Releases. Our theory is that if companies are hiring and paying to run press releases, they must be somewhat bullish on the future. We believe the opposite is true as well. When companies are not hiring and not paying for product announcements, then the industry is somewhat bearish.
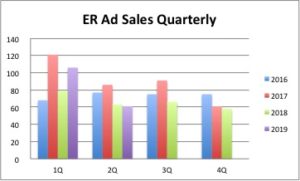
Our numbers are provided below and we look at monthly totals from JAN 2016 thru 15 MAY of 2019. Our main takeaway is that 1Q 2019 is strong and this corresponds to what we hear from our sources. We show 106 ads for the first quarter this year vs 79 for the same quarter in 2018–a 34% increase.
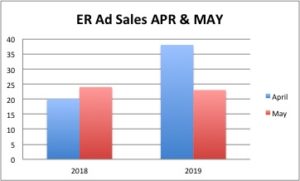
The second quarter gets better. April of 2018, ER showed 20 ads vs 38 for 2019, a 90% increase. May of last year shows 24 ads vs 23 for May of this year, but our current data only runs through 15 May. We believe these strong numbers correlate to an increase in sales and a bright second half.
Our EdisonReport index is not scientific and should not be used by itself in forecasting and decision making. It is simply one additional metric to look at the vibrancy of our industry.
| Edison Report | ||||||||||||||
| Ad Sales Summary | ||||||||||||||
| 2016,2017,2018, YTD 2019 | ||||||||||||||
| Jan-16 | Feb-16 | Mar-16 | Apr-16 | May-16 | Jun-16 | Jul-16 | Aug-16 | Sep-16 | Oct-16 | Nov-16 | Dec-16 | Total | ||
| Quantity | Quantity | Quantity | Quantity | Quantity | Quantity | Quantity | Quantity | Quantity | Quantity | Quantity | Quantity | Quantity | ||
| Employment Ad | 4 | 19 | 14 | 12 | 16 | 19 | 14 | 15 | 18 | 12 | 21 | 14 | 178 | |
| Press Release | 9 | 14 | 8 | 14 | 9 | 7 | 9 | 5 | 14 | 10 | 9 | 9 | 117 | |
| Total Advertising | 13 | 33 | 22 | 26 | 25 | 26 | 23 | 20 | 32 | 22 | 30 | 23 | 0 | 295 |
| 68 | 77 | 75 | 75 | |||||||||||
| Jan-17 | Feb-17 | Mar-17 | Apr-17 | May-17 | Jun-17 | Jul-17 | Aug-17 | Sep-17 | Oct-17 | Nov-17 | Dec-17 | Total | ||
| Quantity | Quantity | Quantity | Quantity | Quantity | Quantity | Quantity | Quantity | Quantity | Quantity | Quantity | Quantity | Quantity | ||
| Employment Ad | 21 | 17 | 25 | 20 | 20 | 9 | 13 | 16 | 20 | 7 | 12 | 4 | 184 | |
| Press Release | 28 | 14 | 16 | 16 | 13 | 8 | 14 | 19 | 9 | 14 | 16 | 8 | 175 | |
| Total Advertising | 49 | 31 | 41 | 36 | 33 | 17 | 27 | 35 | 29 | 21 | 28 | 12 | 0 | 359 |
| 121 | 86 | 91 | 61 | |||||||||||
| Jan 2018 | Feb 2018 | Mar 2018 | Apr 2018 | May 2018 | Jun 2018 | Jul 2018 | Aug 2018 | Sep 2018 | Oct 2018 | Nov 2018 | Dec 2018 | Total | ||
| Quantity | Quantity | Quantity | Quantity | Quantity | Quantity | Quantity | Quantity | Quantity | Quantity | Quantity | Quantity | Quantity | ||
| Employment Ad | 18 | 10 | 15 | 8 | 7 | 10 | 9 | 11 | 6 | 7 | 11 | 10 | 122 | |
| Press Release | 7 | 14 | 15 | 12 | 17 | 9 | 12 | 9 | 19 | 16 | 7 | 7 | 144 | |
| Total Advertising | 25 | 24 | 30 | 20 | 24 | 19 | 21 | 20 | 25 | 23 | 18 | 17 | 0 | 266 |
| 79 | 63 | 66 | 58 | |||||||||||
| Jan 2019 | Feb 2019 | Mar 2019 | Apr 2019 | May 2019 | Jun 2019 | |||||||||
| Quantity | Quantity | Quantity | Quantity | Quantity | Quantity | |||||||||
| Employment Ad | 25 | 14 | 23 | 21 | 6 | |||||||||
| Press Release | 5 | 17 | 22 | 17 | 17 | |||||||||
| Total Advertising | 30 | 31 | 45 | 38 | 23 | |||||||||